Data analysis with Python
Keywords: python, pandas, matplotlib, seaborn
I have completed Data Analysis with Python projects and obtained the certificate for data analysis that is equivalent to 300 hours training.
Projects are:
- Mean-Variance-Standard Deviation Calculator
- Demographic Data Analyzer
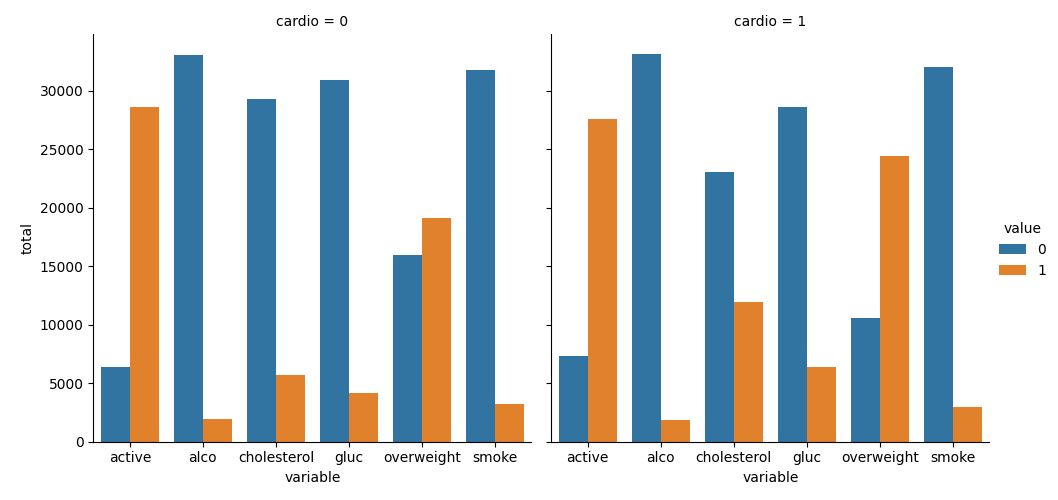
- Medical Data Visualizer
Counts of good and bad outcomes for the cholesterol, gluc, alco, active, and smoke variables for patients with cardio=1 and cardio=0:
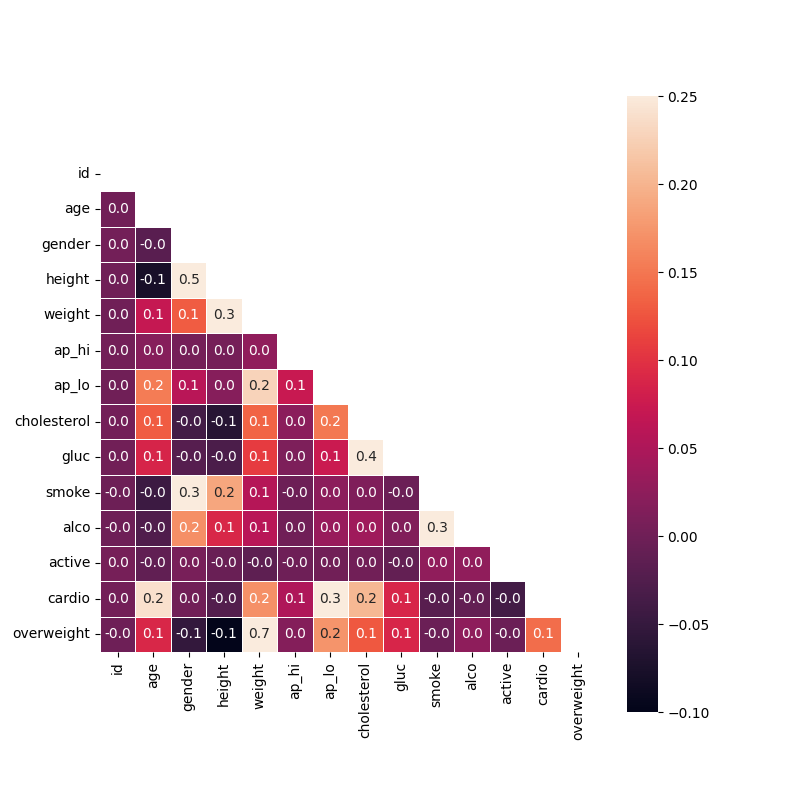
 Correlations between cardiac disease, body measurements, blood markers, and lifestyle choices:
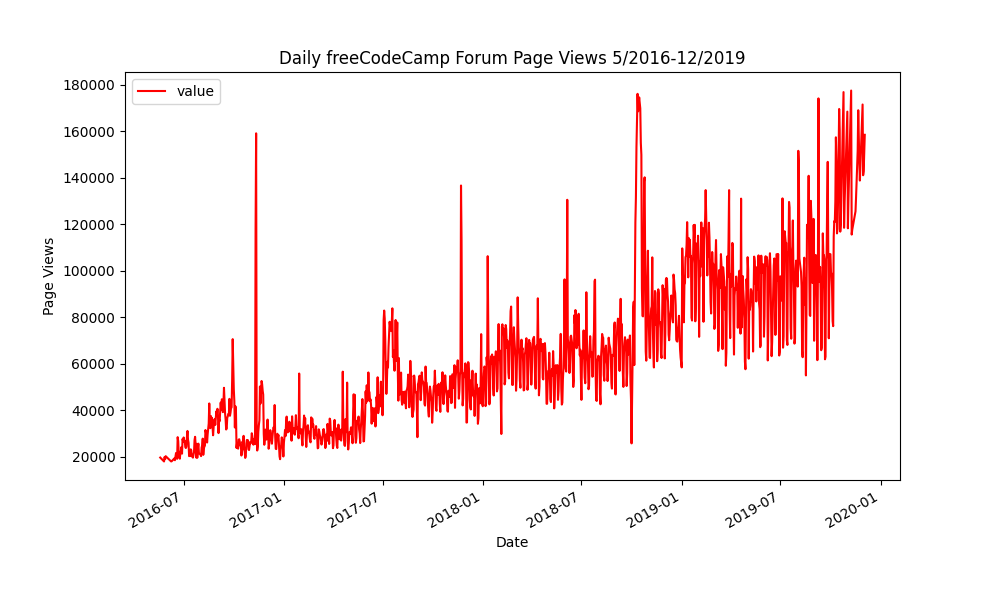
- Page View Time Series Visualizer
Daily page views of freeCodeCamp Forum from 2016 to 2020:
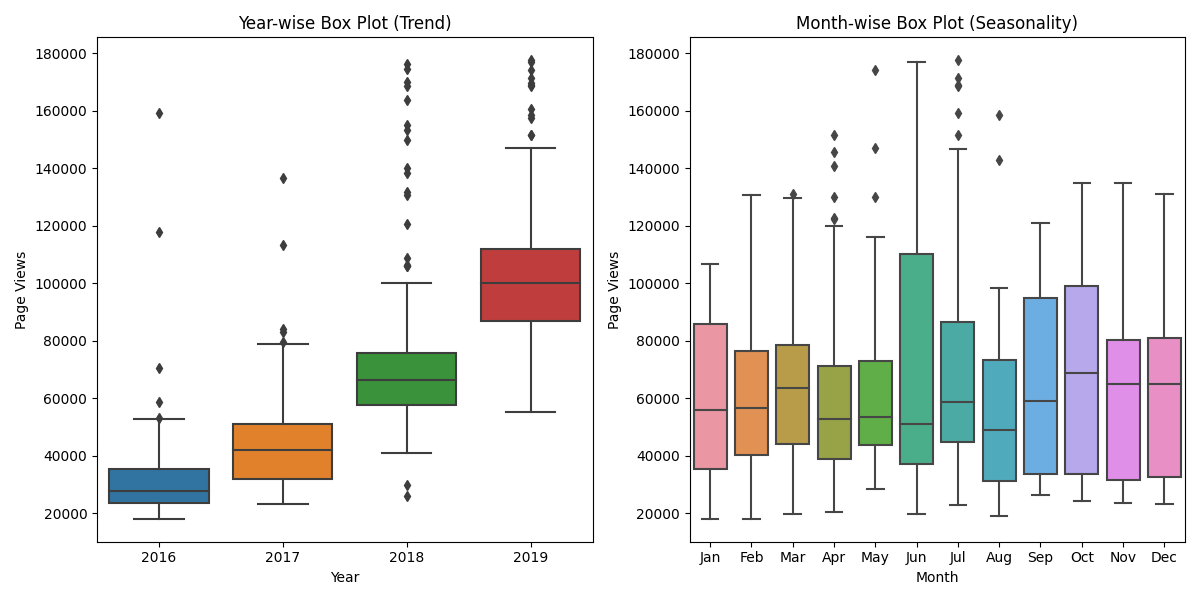
 Daily page views are distributed within a given year or month and it is compared over time:
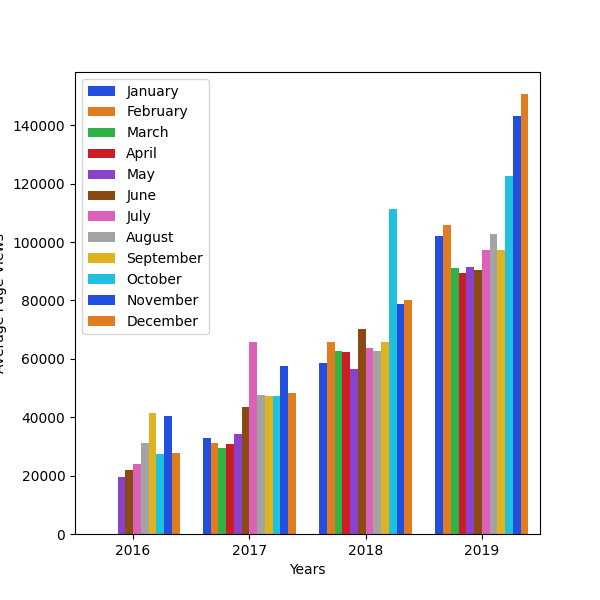
 Average daily page views for each month grouped by year:
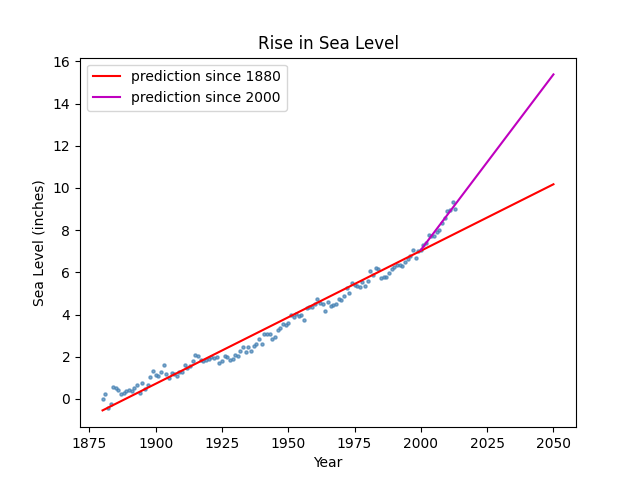
- Sea Level Predictor
How would be the sea level in 2050 based on data since 1880 or 2000?